North Star Metric: Definition, Examples & How to Find Yours
What makes a good North Star Metric: criteria, famous examples (Spotify, Airbnb, Slack), input metrics tree, NSM vs OKRs, and a workshop to find yours.
By the RoadmapHero team · Updated on · 6 min read

Key takeaways
- A North Star Metric is the single measure that best captures the core value a product delivers to customers, chosen so that growing it sustainably grows the business.
- A good North Star Metric expresses customer value, leads revenue, is measurable and countable, can be influenced by every team and reflects how often value is delivered.
- Well-known examples include time spent listening at Spotify, nights booked at Airbnb, messages sent within active teams at Slack and completed rides at Uber.
- Break the North Star into 3 to 5 input metrics with one owner each, and use quarterly OKRs to attack whichever input is currently the weakest.
A North Star Metric (NSM) is the single measure that best captures the core value your product delivers to customers — chosen so that growing it sustainably grows the business. It's the antidote to two common diseases: teams optimizing forty disconnected KPIs, and teams optimizing revenue directly while the value that produces revenue quietly erodes. This guide covers what makes a good NSM, well-known examples, how it fits with OKRs, and how to find yours in a single workshop.
What is a North Star Metric?
The concept comes from the growth community (popularized by Sean Ellis and Amplitude): instead of steering by output ("features shipped") or by results that lag months behind ("ARR"), you steer by the moment of value exchange — the countable event where a customer actually gets what they came for. When that number grows, retention, word of mouth and revenue follow; when it stalls, no amount of pipeline hides it for long.
A good NSM plays three roles at once: alignment (every team can ask "does this move the star?"), prioritization (bets are compared by expected impact on it), and early warning (it moves before revenue does).
Criteria of a good NSM
Test any candidate against five criteria:
It expresses customer value: the event only happens when the customer wins, not when you do (a sent invoice is your win; a paid-on-time invoice is theirs).
It leads revenue: sustained growth in the NSM should show up in revenue two or three quarters later. If you can grow one without the other, the metric is off.
It's measurable and countable: an event your analytics can log today, not a sentiment.
It's influenceable by every team: product, marketing, sales and support can all name actions that move it.
It reflects frequency of value: prefer "weekly active teams creating X" over "accounts that once did X".
Note the tension the NSM deliberately resolves: pure customer-value metrics can ignore the business, pure revenue metrics can ignore the customer. The star sits exactly where value delivered and business results overlap.
Famous examples
Company | North Star Metric (public/reported) | Why it works |
|---|---|---|
Spotify | Time spent listening | Listening is the value; it predicts subscriptions and retention |
Airbnb | Nights booked | Value for both guest and host, directly tied to revenue |
Slack | Messages sent within active teams | Team communication is the product's job; predicts paid conversion |
Duolingo | Daily active learners | Learning requires daily practice; streaks drive both value and monetization |
Uber | Completed rides | One countable event where rider, driver and platform all win |
Notice the pattern: every one of these is a value event, not a vanity total, and each sits upstream of revenue. A roadmap tool's equivalent might be "roadmaps actively shared and viewed by stakeholders each week" — because a roadmap nobody looks at delivers no value, whatever the signup count says.
NSM vs OKRs: complementary, not rivals
Teams sometimes hesitate between a North Star and OKRs. The two operate at different time scales and do different jobs:
The NSM is constant — a multi-year definition of value that rarely changes.
OKRs are seasonal — quarterly ambitions that attack whichever input of the NSM is currently weakest.
In practice, the NSM generates your best Key Results: if the star is "weekly active teams" and diagnosis shows activation is the bottleneck, this quarter's objective becomes an activation push with KRs on time-to-value. Our guide on writing OKRs with examples shows how to phrase these well. The NSM tells you where north is; OKRs decide which leg of the journey you're walking this quarter.
The input metrics tree
A North Star alone is too big to act on — nobody "works on nights booked". The operational tool is the input tree: decompose the NSM into 3–5 input metrics that multiply or add up to it, then assign owners. For "nights booked":
Searches with intent (demand) — grown by marketing and SEO.
Search-to-booking conversion (matching) — grown by product.
Available quality listings (supply) — grown by the host team.
Rebooking rate (retention) — grown by experience quality.
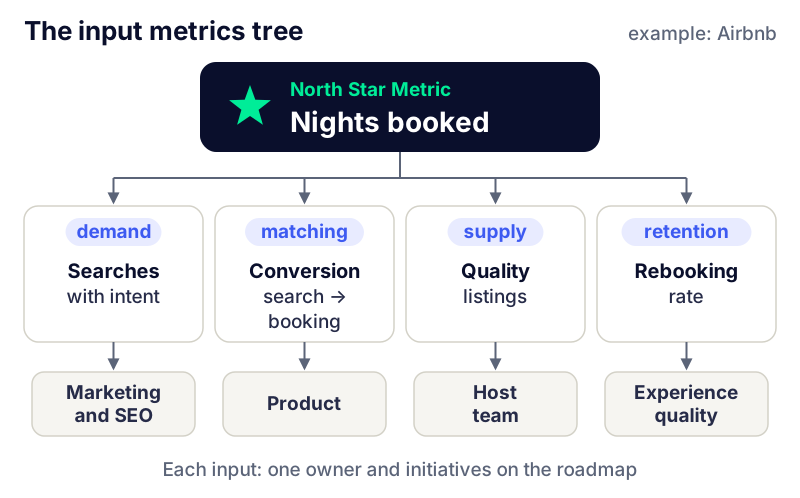
Each input is a leading indicator of the star, and each maps to initiatives on the roadmap. This tree is also your best defense against metric myopia: if bookings grow while rebooking collapses, the tree shows you're borrowing growth from the future. The same leading/lagging logic applies to your broader product metrics and KPIs.
Find yours in one workshop
A 90-minute format that works with 5–8 people (product, tech, data, GTM):
Write the value sentence (15 min): "our customer wins when …". Anchor it in your product strategy — the NSM must measure the strategy, not contradict it.
List candidate value events (20 min): every countable moment where that win happens.
Score candidates (20 min) against the five criteria above, on a simple 1–3 scale.
Stress-test the top two (20 min): "how could we grow this metric while destroying the business?" If the answer is easy, the metric is gameable — refine it (add "active", "weekly", "retained").
Draft the input tree (15 min): 3–5 inputs, one owner each. Commit to a 6-month review, then stop touching it.
Common mistakes
NSM = gross revenue: revenue lags value and invites customer-hostile optimization. Keep revenue on the exec dashboard; keep the star on value.
Changing the star every month: an NSM that changes with each planning cycle is a KPI with delusions of grandeur. Stability is the feature.
A ratio nobody can act on: exotic composites ("value index = 0.3×A + 0.7×B") defeat the alignment purpose. If you can't explain it to a new hire in one sentence, simplify.
A star without a tree: teams can't act on the top-line number; without inputs and owners it becomes a poster, not a practice.
Ignoring counter-metrics: pair the star with 1–2 guardrails (quality, margin, support load) so growth doesn't cannibalize health.
Steering by your NSM in RoadmapHero
In RoadmapHero, the North Star fits naturally into the strategy layer: state it in your product vision, then express each input metric as an Objective with measurable Key Results. Backlog items link to those OKRs, so the HeroScore's business-value dimension literally answers "does this move an input of the star?". The AI progression analysis summarizes how each Key Result — and thus each branch of your input tree — is trending, and shared strategy views keep the star visible to stakeholders. See also aligning your roadmap with OKRs. Free trial, transparent pricing in euros, no commitment.
Frequently asked questions
Can a company have several North Star Metrics?
One per product is the rule of thumb. A multi-product company can run one NSM per product line, but a single product with three "north stars" has none — the entire point is forcing one shared definition of value.
Should revenue be your North Star Metric?
Usually not. Revenue is a lagging result of value, not the value itself, and teams can grow it short-term in ways that hurt customers (pushy upsells, dark patterns). Good NSMs capture the customer value that leads to revenue — like weekly active teams or orders delivered on time.
How often should the North Star Metric change?
It should survive several years. You revise it when the strategy fundamentally shifts — new business model, new core audience — not every quarter. If you feel the urge to change it monthly, the problem is usually the metric's definition, not the star itself.
What is the difference between a North Star Metric and a KPI?
The NSM is the single metric that best captures the value your product delivers; KPIs are the broader set of numbers you steer by. The NSM sits at the top, the input metrics and KPIs decompose it into levers teams can actually move.
Does a North Star Metric work for early-stage startups?
Yes, with a caveat: before product-market fit, your NSM is a hypothesis about value, so expect to refine its definition as you learn. Even then, it forces the team to articulate what "value delivered" means — which is precisely the pre-PMF question.