WSJF Prioritization: The Complete Guide (2026)
Master WSJF prioritization: Cost of Delay broken down, job size, a worked example, its role in SAFe, when it beats RICE and how to adapt it outside SAFe.
By the RoadmapHero team · Updated on · 7 min read

Key takeaways
- WSJF (Weighted Shortest Job First) ranks work by dividing Cost of Delay by job size, so the highest ratio delivers the most value per unit of capacity.
- Cost of Delay sums three relative components, business value, time criticality and risk reduction or opportunity enablement, each scored on a modified Fibonacci scale.
- WSJF beats RICE for deadlines, compliance and platform or tech-debt work, while RICE fits discovery backlogs because its Confidence factor discounts weak evidence.
- Outside SAFe, a lighter WSJF works: two numerator questions, t-shirt job sizes, and a 45-minute monthly session scoring only the top 20 or so backlog items.
WSJF (Weighted Shortest Job First) is the prioritization method that takes time seriously. Where most frameworks ask "how valuable is this?", WSJF asks the sharper economic question: "how much does it cost us to do this later instead of now?" Popularized by SAFe and grounded in Don Reinertsen's product development economics, it ranks work by Cost of Delay divided by job size. This guide decomposes Cost of Delay into its three components, walks through a full worked example, explains WSJF's role in SAFe, compares it with RICE, and proposes a pragmatic adaptation for teams that are nowhere near SAFe.
What is WSJF?
The formula:
WSJF = Cost of Delay / Job Size
The intuition comes from queueing economics. If two jobs are equally valuable, do the short one first: you bank its value earlier and delay the other's value by less. If two jobs are the same size, do the one whose delay costs more. WSJF generalizes both rules into a single ratio — value-per-unit-of-time-consumed. Sequencing by this ratio provably maximizes the total value delivered by a capacity-constrained team, which is why Reinertsen calls it the only sensible default when you cannot quantify everything precisely.
Cost of Delay, decomposed into 3 components
Cost of Delay (CoD) is what one unit of time of postponement costs you. Because estimating it in euros is hard, SAFe decomposes it into three relative components, each scored on a modified Fibonacci scale (1, 2, 3, 5, 8, 13, 20):
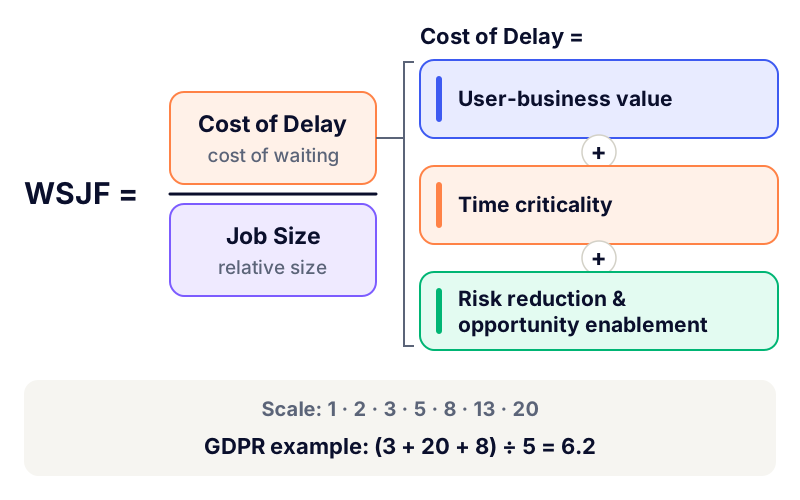
1. User-business value
The classic value question: how much do users prefer this? What is the revenue impact, the cost saving, the penalty avoided? This is the component every other framework also has. Tie it to your OKRs so "value" means something specific.
2. Time criticality
The component that makes WSJF unique: how does the value decay with time? A feature for a trade-show demo is worthless the day after the show. A regulatory deadline has a cliff. A competitor announcement erodes value week by week. A generic UX improvement, by contrast, delivers the same value whether shipped in March or June — low time criticality. Ask: "is there a deadline? does value decay? will customers wait, or churn meanwhile?"
3. Risk reduction and opportunity enablement
The strategic component: what future value does this unlock or protect, beyond its direct value? Paying down the flaky deployment pipeline reduces the risk of every future release. Building a public API enables integrations you cannot list yet. This is where platform work and technical debt — chronically starved by user-facing scoring — earn legitimate points.
Job size
The denominator is the relative size of the job — SAFe deliberately uses size as a proxy for duration, since teams estimate size far more reliably. Score it on the same Fibonacci scale, or reuse your story point estimates aggregated at epic level. Two warnings: use the total size across all teams involved (a "small" feature needing three teams is not small), and never let the same person who wants a high WSJF also set the job size — shrinking the denominator is the oldest trick in the book.
Calculation with a worked example
A B2B platform team compares four epics for the next quarter. Each component is scored relatively (at least one "1" per column as anchor):
Epic | Business value | Time criticality | Risk/opportunity | CoD (sum) | Job size | WSJF |
|---|---|---|---|---|---|---|
GDPR consent revamp (legal deadline) | 3 | 20 | 8 | 31 | 5 | 6.2 |
Self-serve onboarding | 13 | 3 | 5 | 21 | 8 | 2.6 |
Reporting module v2 | 8 | 1 | 1 | 10 | 13 | 0.8 |
CI/CD pipeline overhaul | 1 | 2 | 13 | 16 | 3 | 5.3 |
Read the result: the GDPR epic wins on urgency, as expected. But the surprise is the CI/CD overhaul at 5.3, ahead of the flashy onboarding epic — a small job with a big risk-reduction payoff scores brilliantly on value-per-capacity. That is WSJF doing its job: it systematically rehabilitates small, unglamorous, enabling work that value-only rankings bury. Meanwhile the big reporting module, valuable but huge and not urgent, correctly drops to the bottom — perhaps to be split, since halving a job size doubles its WSJF.
The place of WSJF in SAFe
In the Scaled Agile Framework, WSJF is the official mechanism for sequencing features and capabilities in the Program Backlog. It is typically applied during PI (Program Increment) planning preparation, with product management, system architects and business owners scoring together — the debate about a "13 vs 8" on time criticality is where the real alignment happens. SAFe's design choices make sense at scale: relative Fibonacci scores avoid endless euro-quantification debates across dozens of teams, and re-scoring every PI keeps rankings fresh. If you run SAFe, WSJF is not optional decoration; it is the backbone of the economic sequencing the framework promises, alongside your agile roadmap.
When WSJF beats RICE (and vice versa)
Situation | Better fit | Why |
|---|---|---|
Deadlines, compliance, market windows | WSJF | Time criticality is a first-class factor |
Heavy platform/tech-debt portfolio | WSJF | Risk reduction / enablement earns explicit points |
Discovery-stage backlog, unproven bets | RICE | Confidence explicitly discounts weak evidence |
User-facing growth work with analytics | RICE | Reach uses real user counts, not relative guesses |
Multi-team quarterly sequencing | WSJF | Relative scales work without shared analytics |
The deeper difference: RICE prices uncertainty (Confidence) but ignores urgency; WSJF prices urgency but has no confidence factor — a wild guess scores as confidently as a measured fact. Mature teams sometimes borrow across: adding a time-criticality criterion to RICE, or sanity-checking WSJF inputs with evidence reviews.
Limits of WSJF outside SAFe
Fully relative scores: a WSJF of 6.2 means nothing outside its comparison batch. You cannot compare this quarter's scores with last quarter's, or one team's with another's, without re-anchoring.
No confidence dimension: enthusiastic guesses and hard data score identically. Pair scoring sessions with evidence requirements.
Sum masks profile: CoD = 3 + 20 + 8 and CoD = 20 + 3 + 8 are both 31, yet describe totally different items. Keep component scores visible, not just the total.
Ceremony cost: three components × Fibonacci debates × many items is a real meeting burden for a 6-person startup — overkill below a certain portfolio size.
Splitting games: since smaller jobs score better, teams learn to slice items until they win. Healthy when it produces genuinely incremental value; degenerate when the "first slice" is meaningless without the rest.
A pragmatic WSJF adaptation for non-SAFe teams
You do not need SAFe to use the economics. A lightweight version that works for a single product team:
Two numerator questions instead of three: "how much value?" (1–10) and "how badly does waiting hurt?" (1–10). Merge risk/enablement into the value question unless platform work is chronically starved.
Job size in t-shirt sizes mapped to numbers (S=1, M=3, L=8, XL=20) — or your existing story points.
Score in a 45-minute monthly session, PM + tech lead + one business stakeholder, only on the top ~20 backlog items.
Sequence by the ratio, then apply judgment — and write down every override, because overrides are where strategy (or politics) hides. Fold this into your regular backlog prioritization ritual.
WSJF-style scoring in RoadmapHero
Running WSJF in a spreadsheet means re-copying ticket lists every month and losing the component scores in the process. In RoadmapHero, HeroScore lets you configure a WSJF-style model directly on the backlog: business value linked to your OKRs, an urgency criterion for time criticality, a risk criterion for reduction/enablement, and effort as the denominator — with weights you tune to your context. Component values stay visible on each ticket, scores update as estimates change, and AI-assisted prioritization flags inconsistencies between a ticket's score and its linked evidence. The ranked backlog flows straight into roadmap and planning views you can share with unlimited viewers. Free trial, transparent pricing in euros, no commitment.
Frequently asked questions
What does WSJF stand for?
WSJF means Weighted Shortest Job First. It ranks work by dividing the Cost of Delay (business value + time criticality + risk reduction/opportunity enablement) by the job size. The highest ratio goes first: maximum value delivered per unit of capacity.
What scale is used for WSJF scoring?
SAFe uses a modified Fibonacci scale (1, 2, 3, 5, 8, 13, 20) for each of the four components, scored relatively across the set of items being compared. At least one item in each column should get a 1 as the anchor, and every score only has meaning within that comparison batch.
Is WSJF only for SAFe organizations?
No. The underlying economics — sequence by Cost of Delay divided by duration, from Don Reinertsen's work — apply to any queue of work. Non-SAFe teams typically simplify: fewer components, a lightweight scoring session, and job size in story points or t-shirt sizes.
What is the difference between WSJF and RICE?
RICE multiplies Reach, Impact and Confidence, then divides by Effort; WSJF divides Cost of Delay by job size. The practical differences: WSJF explicitly prices urgency (time criticality), while RICE explicitly prices uncertainty (Confidence). Deadline-heavy portfolios favor WSJF; discovery-heavy backlogs favor RICE.
How often should WSJF scores be updated?
Re-score at every planning boundary — each Program Increment in SAFe (roughly quarterly), or monthly for teams using it on a rolling backlog. Time criticality changes fast by definition, so a stale WSJF ranking is worse than a stale RICE ranking.