RICE Scoring Framework: The Complete Guide (2026)
Master the RICE scoring framework: Reach, Impact, Confidence, Effort with scales, a worked example, classic mistakes and how to automate your scoring.
By the RoadmapHero team · Updated on · 8 min read

Key takeaways
- RICE is a prioritization method developed at Intercom by Sean McBride that scores each backlog item as (Reach × Impact × Confidence) / Effort.
- Reach counts people affected per fixed period, Impact uses a scale from 3 to 0.25, Confidence is typically 100%, 80% or 50%, and Effort is measured in person-months.
- A higher RICE score means more value per unit of effort, but a score only has meaning relative to other items in the same backlog scored with the same scales.
- RICE ignores time criticality and scores strategic bets for small segments low, so use it as an input to judgment and re-score the top 15–20 items monthly.
The RICE scoring framework is the most widely used prioritization method in product management, and for a good reason: it forces you to compare wildly different backlog items — a new integration, a UX fix, a pricing experiment — with one comparable number. This guide covers everything: the four factors with concrete scales, a worked example with three features scored step by step, the classic mistakes (fake Reach, confidence theater), and how RICE compares with MoSCoW, WSJF or a value/effort matrix.
What is the RICE framework?
RICE was developed at Intercom by Sean McBride to help product managers rank initiatives objectively. The formula is:
RICE score = (Reach × Impact × Confidence) / Effort
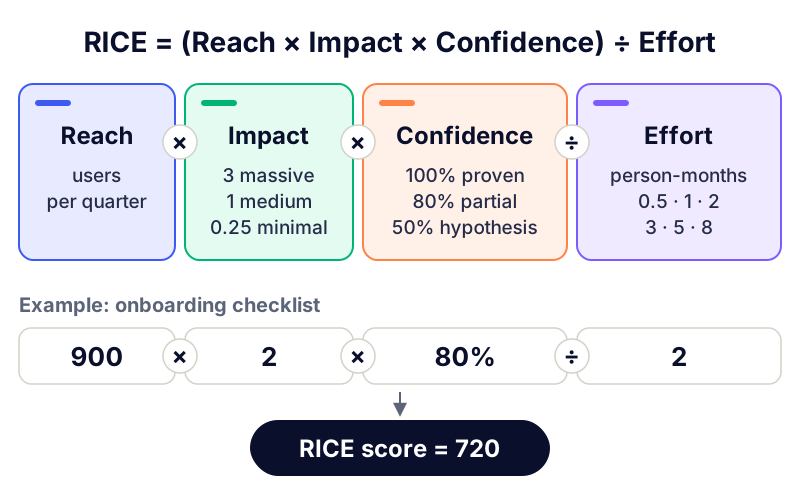
The numerator estimates total expected value (how many people, how much per person, discounted by how sure you are). The denominator is the cost to deliver it. The result reads as "value per unit of effort" — the higher, the sooner you should build it. Unlike a gut-feel ranking, every input is a claim you can challenge, source and revise. That is the real point of RICE: it turns prioritization from a battle of opinions into a review of assumptions.
The 4 factors in detail, with scales
Reach — how many people, per period
Reach is the number of users (or customers, or accounts) affected by the item within a defined time window — typically per quarter. Always pick one window and stick to it for the whole backlog, otherwise scores are not comparable. Good sources: analytics (how many users hit this screen per quarter?), support ticket counts, the number of customers who requested the feature, sign-up volumes for acquisition items.
"1,800 users open the export screen each quarter" → Reach = 1,800.
"About 40 of our 300 accounts asked for SSO" → Reach = 40 accounts (score account-level items together).
Never use "all our users" unless the item genuinely touches every session.
Impact — how much per person
Impact estimates how strongly the item moves your goal for each person reached. Because that is hard to measure precisely, Intercom uses a multiple-choice scale:
3 — massive impact (changes the user's decision or workflow)
2 — high impact
1 — medium impact
0.5 — low impact
0.25 — minimal impact
Tie the scale to a real goal ("impact on activation rate", "impact on churn"), not to a vague notion of "value". An item can have Impact 3 for retention and 0.25 for acquisition — decide which goal you are scoring against.
Confidence — how sure are you
Confidence discounts enthusiasm. It is a percentage that reflects the quality of your evidence for Reach and Impact:
100% — quantitative data for Reach and tested evidence for Impact (experiment, strong user research).
80% — data for one factor, informed judgment for the other.
50% — plausible hypothesis, little supporting evidence.
Below 50% — you are guessing; go do discovery before scoring.
Stick to these three or four levels. A confidence of "73%" is precision theater — no one can defend the difference between 73% and 68%.
Effort — total cost in person-months
Effort is the total work required from everyone involved — product, design, engineering, QA — expressed in person-months (or person-weeks for a fast-moving backlog; again, one unit for everything). Estimate roughly: 0.5, 1, 2, 3, 5, 8. RICE does not reward false precision, and relative estimation is usually enough to place an item on that scale.
Worked example: scoring 3 features step by step
Say you run a B2B SaaS with 4,000 monthly active users and your quarterly goal is to improve activation and expansion. Three candidates compete for the next cycle:
Onboarding checklist. Analytics show ~900 new users sign up per quarter and all of them see the first-run experience → Reach = 900. User interviews showed confusion in the first session, and a prototype tested well → Impact = 2, Confidence = 80%. Design + build ≈ 2 person-months.
Slack integration. 1,200 users belong to accounts that answered "we live in Slack" in the last survey → Reach = 1,200. It removes a minor friction rather than changing behavior → Impact = 1. The survey data is solid → Confidence = 100%. Integration + notification settings ≈ 3 person-months.
Admin analytics dashboard. Only account admins would use it: ~150 per quarter → Reach = 150. For them it could be decisive at renewal → Impact = 3, but the evidence is two sales anecdotes → Confidence = 50%. It needs a data pipeline ≈ 4 person-months.
Feature | Reach | Impact | Confidence | Effort | RICE score |
|---|---|---|---|---|---|
Onboarding checklist | 900 | 2 | 80% | 2 | 720 |
Slack integration | 1,200 | 1 | 100% | 3 | 400 |
Admin dashboard | 150 | 3 | 50% | 4 | 56 |
The math: (900 × 2 × 0.8) / 2 = 720; (1,200 × 1 × 1.0) / 3 = 400; (150 × 3 × 0.5) / 4 = 56. Notice what the score does: the dashboard felt exciting ("Impact 3!") but low Reach, weak evidence and high Effort push it down. The right move is not to kill it — it is to raise its Confidence with a few admin interviews, then re-score. RICE tells you where to invest in discovery, not just what to build.
Strengths and limits of RICE
Strengths
Comparability: heterogeneous items end up on one scale.
Explicit uncertainty: Confidence is the only mainstream framework factor that penalizes guesswork.
Cheap to run: 5 minutes per item once your scales are set.
Debate-friendly: stakeholders challenge an input ("why Reach 900?") instead of relitigating the whole decision.
Limits
It optimizes for breadth: strategic bets serving a small segment (enterprise features, new markets) score structurally low.
It ignores time criticality: a compliance deadline or a competitor window does not show up anywhere in the formula — that is where WSJF and its Cost of Delay is stronger.
Dependencies, risk reduction and platform work need a deliberate Impact convention or they get starved.
Garbage in, garbage out: with invented Reach numbers, RICE just launders opinions into decimals.
Useful RICE variants
ICE — Impact × Confidence × Ease, no Reach. Faster, good for growth experiments where everything targets the same funnel. See the ICE scoring guide.
RICE + goal weighting — score Impact per OKR and weight goals differently (e.g. retention counts double this quarter).
Revenue-Reach — for B2B, replace user counts with ARR affected. Useful when 5 accounts represent half your revenue.
Team-split Effort — track design/engineering effort separately when one of the two is the bottleneck; divide by the constrained resource.
Classic mistakes that ruin RICE scores
Fake Reach: "all 4,000 users" for a feature only power users will find. Reach must come from analytics or counted requests, not from hope.
Confidence theater: everything gets 80% because 50% feels like an admission of failure. If nothing ever scores 50%, your Confidence factor is dead.
Retro-fitted scores: deciding first, scoring afterwards to justify it. The score becomes political wallpaper and the team notices immediately.
Mixed time windows: Reach per month for one item, per year for another. Scores become incomparable.
Ranking by score alone: RICE is an input to judgment, not a replacement for it. A low-scoring strategic bet can still be right — but you must say so explicitly instead of inflating its numbers.
Scoring once: estimates decay. Re-score the top of the backlog monthly, as part of a broader backlog prioritization ritual.
RICE vs other prioritization frameworks
Framework | Best for | Compared with RICE |
|---|---|---|
MoSCoW | Scoping an MVP or a deadline project | Categories, not ranking — coarser but faster with stakeholders |
WSJF | SAFe portfolios, time-sensitive work | Adds time criticality; heavier, fully relative scales |
Kano | Understanding satisfaction drivers | Research model, not a ranking formula — feeds better Impact inputs |
Value/Effort matrix | Quick workshop alignment | 2 axes instead of 4 factors — simpler, less rigorous |
In practice: use a value vs effort matrix to triage a raw idea list, RICE to rank what survives, and Kano research to strengthen your Impact estimates on the finalists.
Automating RICE scoring with HeroScore in RoadmapHero
A RICE spreadsheet works — until it drifts out of sync with the backlog. In RoadmapHero, HeroScore runs the same logic directly on your tickets: configurable criteria for business value (linked to your OKRs), user value (weighted by Customer Voice feedback volume), effort, risk and urgency, each with the weights you choose. You can reproduce classic RICE or extend it with the time-criticality dimension it lacks. Scores update as feedback and estimates change, the ranked backlog feeds the roadmap views you share with stakeholders, and AI-assisted prioritization flags items whose scores look inconsistent with their evidence. Free trial, transparent pricing in euros, no commitment — and unlimited viewers on shared views, so the ranking is visible to everyone it concerns.
Frequently asked questions
Who invented the RICE framework?
RICE was popularized by Sean McBride at Intercom around 2016 as an internal prioritization method for the product team. It spread quickly because it balances value (Reach × Impact) against cost (Effort) while making uncertainty explicit through Confidence.
What is a good RICE score?
There is no universal threshold: a RICE score is only meaningful relative to the other items in the same backlog, scored with the same scales. Use it to rank, not to judge items in isolation, and re-score whenever your inputs change.
How often should I re-score my backlog with RICE?
Re-score the top 15–20 items of your backlog monthly, and any item whose Reach, Effort or Confidence data has changed. A RICE score computed once and never revisited becomes decorative within a quarter.
What is the difference between RICE and ICE?
ICE (Impact, Confidence, Ease) drops the Reach factor and multiplies three gut-feel scores, which makes it faster but less rigorous. RICE forces you to quantify how many users are actually affected, which is exactly where wishful thinking usually hides.
Can I use RICE for bugs and technical debt?
Yes. Estimate Reach as the number of users hitting the bug or affected by the slowdown, Impact as the severity per user, and Effort as usual. Scoring debt with the same formula as features prevents it from being permanently deprioritized.