ICE Scoring Framework: Prioritize Ideas Fast (2026 Guide)
Learn the ICE scoring framework: rate Impact, Confidence and Ease to rank ideas in minutes. Scales, a worked example and ICE vs RICE compared. Try it now.
By the RoadmapHero team · Updated on · 7 min read

Key takeaways
- ICE scoring rates each idea from 1 to 10 on Impact, Confidence and Ease, then ranks ideas by the average, or sometimes the product, of the three scores.
- ICE was popularized by growth practitioner Sean Ellis for experiment pipelines, where scoring an idea in under a minute matters more than precision.
- Written scale anchors for each criterion, such as Confidence 9–10 only when a similar test already worked, are the main defense against ICE’s subjectivity.
- Use ICE for growth experiments, early-stage backlogs and request triage, and switch to RICE when reach varies widely between items and can be measured.
The ICE scoring framework is the fastest credible way to prioritize a pile of ideas. You rate each one on three criteria — Impact, Confidence and Ease, each from 1 to 10 — and rank by the resulting score. No spreadsheet gymnastics, no two-hour workshop. That speed is not a shortcut; it is the whole point. ICE was designed for teams that test dozens of ideas per quarter and cannot afford to spend more time scoring an idea than testing it.
What is ICE scoring?
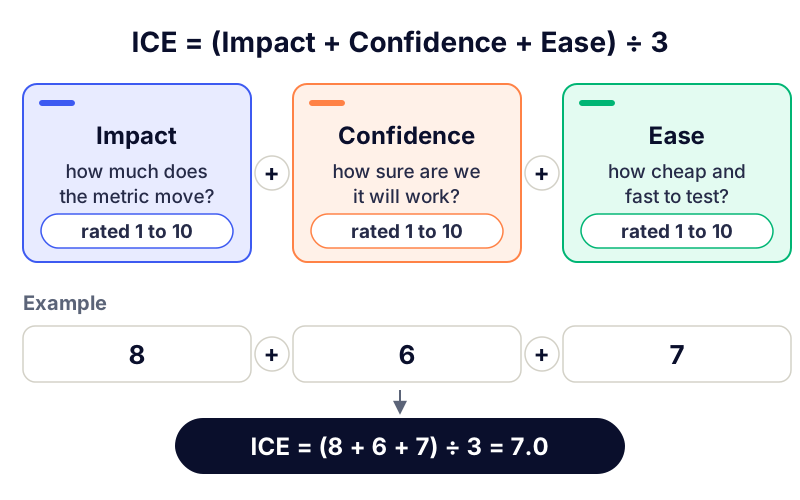
ICE evaluates every candidate idea on three questions:
Impact — if this works, how much does it move the metric we care about? (1 = barely measurable, 10 = game-changing)
Confidence — how sure are we that it will work? What evidence do we have: data, user feedback, past experiments, or just a hunch?
Ease — how cheap and fast is it to implement or test? (10 = an afternoon, 1 = a full quarter)
The ICE score is usually the average of the three numbers, sometimes the product. An idea with Impact 8, Confidence 6 and Ease 7 scores (8+6+7)/3 = 7.0. You then sort the list descending and work from the top. The output is a ranking, not a verdict: ICE tells you what to look at first, not what to ship.
Origins: Sean Ellis and growth hacking
ICE was popularized by Sean Ellis, the growth practitioner who coined the term "growth hacking" and led early growth at Dropbox. In a high-tempo growth process, a team generates far more experiment ideas than it can run — often 50+ ideas for 5 weekly test slots. Ellis needed a scoring method light enough that anyone could score an idea in under a minute, yet structured enough to stop the loudest voice from always winning.
That heritage explains ICE's design choices. Growth experiments are cheap, reversible and numerous, so speed of scoring beats precision of scoring. If a mediocre idea slips to the top, you lose one test slot for a week — not a quarter of engineering time. Product teams adopting ICE should keep this in mind: the framework tolerates noise because its native environment tolerates noise.
How to score Impact, Confidence, Ease
The main failure mode of ICE is fuzzy scales. "Impact 7" means nothing unless the team has agreed on what a 7 is. Write down anchors once, and every future scoring session gets faster and more consistent.
Impact (on one explicit metric)
1–3: cosmetic; would not show up in the metric.
4–6: noticeable lift on a secondary metric (e.g. +2–5% on a step of the funnel).
7–8: clear lift on the primary metric (e.g. +5–15% on activation).
9–10: could change the trajectory of the business.
Confidence (based on evidence, not enthusiasm)
1–3: pure opinion or copied from a competitor.
4–6: supported by qualitative signals (support tickets, interviews).
7–8: supported by our own quantitative data.
9–10: we already ran a similar test and it worked.
Ease (total cost, not just dev time)
1–3: multi-week effort, several teams, migration or legal review.
4–6: a few days for one squad.
7–8: one day or less, no dependencies.
9–10: config change, copy tweak, no-code test.
A worked example with numbers
A B2B SaaS team wants to improve trial-to-paid conversion. Five candidate ideas, scored in one 20-minute session:
Idea | Impact | Confidence | Ease | ICE |
|---|---|---|---|---|
Onboarding checklist in-app | 7 | 8 | 6 | 7.0 |
Reminder email on day 5 of trial | 5 | 7 | 9 | 7.0 |
Interactive product tour | 8 | 5 | 3 | 5.3 |
Redesign of the pricing page | 6 | 4 | 5 | 5.0 |
Sales call for every trial signup | 7 | 6 | 2 | 5.0 |
Two ideas tie at 7.0 — and that is fine. The team runs the day-5 email first (Ease 9 means it ships this week) and starts the checklist in parallel. The product tour, seductive in a slide deck, drops to third once Ease is priced in. This is ICE doing its job: surfacing cheap, well-evidenced wins that gut feeling systematically underrates.
ICE vs RICE: when simplicity wins
The RICE framework adds a fourth dimension, Reach — how many users an item affects per period — and divides by Effort instead of averaging Ease. That extra rigor is valuable, but it has a price: every RICE score needs a reach estimate, which needs analytics, which needs time.
Criterion | ICE | RICE |
|---|---|---|
Time to score one item | < 1 minute | 5–15 minutes |
Data required | None (judgment-based) | Reach estimates per segment |
Best for | Experiments, early-stage backlogs | Mature product backlogs |
Main risk | Subjectivity | False precision, slow upkeep |
Rule of thumb: if your items differ wildly in audience size and you can measure it, RICE earns its overhead. If you are pre-product-market-fit, or scoring growth experiments where every test targets roughly the same funnel, ICE gives you 90% of the ranking quality for 10% of the effort. Many teams also start with a simple value vs effort matrix in workshops, then formalize with ICE once the idea list outgrows a whiteboard.
Limits of ICE (and how to soften them)
Subjectivity: three gut-feel numbers averaged together are still gut feel. Mitigate with written scale anchors and by scoring in pairs.
Score inflation: idea authors rate their own babies 8-9-8. Mitigate by letting someone other than the author score Confidence.
No notion of reach: a fix for 2% of users can outrank a fix for 80% of users. If that distortion hurts, move to RICE.
Ties and clustering: with a 1–10 scale, dozens of items land between 6 and 7.5. Use ICE to build a shortlist, then decide the top 5 by discussion.
Averaging hides vetoes: Impact 9, Confidence 1, Ease 9 scores a respectable 6.3. Multiplying (81 vs 729 max) exposes the weak link better.
None of these flaws is fatal as long as you treat the score as an input to a conversation, not a ruling. Teams that read the ranking, argue about the surprises and adjust are using ICE correctly.
When ICE is the right tool
ICE shines in three situations:
Growth experiment pipelines — its native habitat. Weekly scoring of the test queue, re-scored as results come in.
Early-stage backlogs — a startup with 60 ideas and no analytics history cannot feed RICE honestly. ICE turns chaos into a ranked list in one session, a solid first step before you adopt a heavier prioritization framework.
Triaging inbound requests — a quick ICE pass on incoming feature requests separates "look now" from "park" without ceremony.
Avoid ICE for irreversible, expensive bets (platform migrations, pricing overhauls). Those deserve deeper analysis — a business case, or at least a multi-criteria score. Our guide to the best prioritization tools in 2026 covers what to reach for as your needs mature.
ICE scoring in RoadmapHero
In RoadmapHero you can run ICE without a spreadsheet: add Impact, Confidence and Ease as scoring criteria, score each backlog item, and sort the backlog by the result. When you outgrow pure ICE, the same items feed HeroScore, RoadmapHero's customizable multi-criteria score — business value tied to your OKRs, user value weighted by Customer Voice feedback, effort, risk and urgency. You keep the speed of ICE for triage and gain a defensible, goal-linked ranking for roadmap decisions, with AI-assisted prioritization to challenge your scores. Free trial, transparent pricing in euros, no commitment.
Frequently asked questions
What does ICE stand for in prioritization?
ICE stands for Impact, Confidence and Ease. Each idea gets a 1–10 score on the three criteria, and the ICE score is the average (or the product) of the three. Higher scores get tested or built first.
What is a good ICE score?
ICE scores are relative, not absolute. A 7.3 only means something compared to the other items in the same list, scored by the same people with the same scales. Use ICE to rank a batch of ideas, never to judge one idea in isolation.
Should I multiply or average the ICE scores?
Both work if you stay consistent. Averaging (I+C+E)/3 keeps scores on a familiar 1–10 scale. Multiplying I×C×E spreads results from 1 to 1,000 and punishes items with one very weak dimension, which many growth teams prefer.
When should I use RICE instead of ICE?
Switch to RICE when reach varies a lot between items and you have data to estimate it — typically for a product backlog serving distinct user segments. ICE remains better for fast-moving experiment pipelines and early-stage backlogs where reach data does not exist yet.
How often should ICE scores be updated?
Re-score whenever new evidence lands: an experiment result, user interviews, or a technical spike. For an active growth backlog, a quick weekly re-scoring of the top 10–15 ideas is enough; a full pass once a month keeps the rest honest.