Value vs Effort Matrix: The Complete Guide
Build and run a value vs effort matrix: workshop facilitation, the 4 quadrants explained, classic estimation biases and when to move to richer scoring.
By the RoadmapHero team · Updated on · 8 min read

Key takeaways
- A value vs effort matrix is a 2×2 grid that plots each item by the value it should create and the total team effort it costs, to triage candidates quickly.
- Its four quadrants map to clear decisions: do quick wins first, decide big bets deliberately, do fill-ins opportunistically and avoid time sinks.
- Define value against a stated goal, use a coarse 1–5 scale, place 10 to 25 items per session, and start with a silent individual round to avoid anchoring.
- Move to richer scoring such as RICE or a weighted model when quadrants get crowded, decisions are relitigated, uncertainty matters or several goals compete.
The value vs effort matrix (also called the impact/effort matrix) is prioritization at its most accessible: plot every candidate on two axes — how much value it creates, how much effort it costs — and let the four quadrants do the talking. No formula, no spreadsheet, no training required, which is exactly why it is the best first framework for a team and the best tool for aligning mixed groups of stakeholders in a single workshop. This guide covers how to build the matrix properly, how to facilitate the estimation and placement session, what to actually do with each quadrant, the biases that quietly ruin it, and the signals that you have outgrown it.
What is the value vs effort matrix?
A 2×2 grid. The vertical axis is value: the benefit you expect the item to create — revenue, retention, satisfaction, cost savings — always judged against a stated goal. The horizontal axis is effort: the total cost to design, build, test and ship it. Crossing the two produces four quadrants with self-explanatory strategies:
Low effort | High effort | |
|---|---|---|
High value | Quick wins — do first | Big bets — decide deliberately |
Low value | Fill-ins — do opportunistically | Time sinks — avoid |
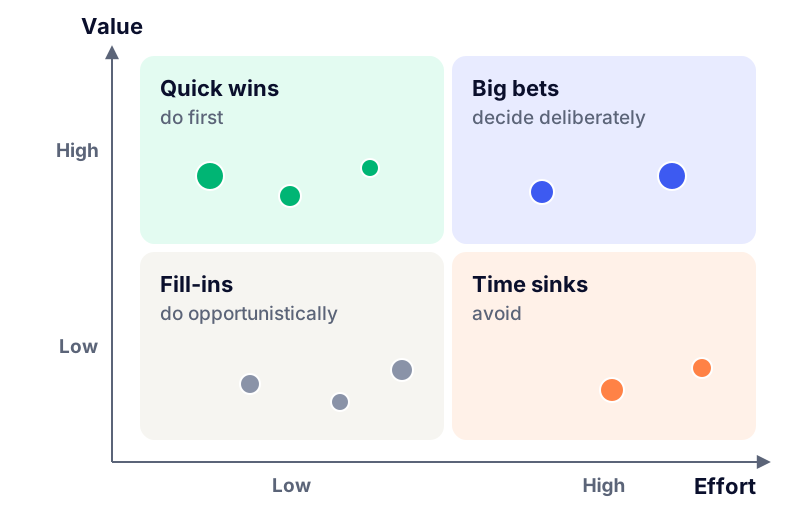
The matrix trades precision for speed and shared understanding. Unlike RICE or WSJF, it produces no ranking inside a quadrant — and that is fine for its job, which is triage: separating the obviously-do from the obviously-don't, and surfacing the items that deserve a harder look.
Building the matrix: axes, scales, definitions
Define value against a goal. "Value" floating free means something different to every participant — sales hears revenue, support hears fewer tickets. Anchor it: "value = contribution to this quarter's activation OKR". One sentence, written above the matrix.
Define effort as total team effort: design + development + QA + rollout, not just "backend complexity". A technically trivial feature with heavy migration and support costs is not low effort.
Pick a coarse scale: 1–5 per axis, or t-shirt sizes. The matrix cannot support decimals — resist them.
Prepare the candidate list: 10–25 items, each with a one-line description everyone can understand without the author explaining it. Ambiguous items produce placements that measure comprehension, not priority.
Running the workshop: estimation, placement, discussion
The matrix's real output is not the picture — it is the conversation the picture forces. A format that works in 60–90 minutes with 4–8 people (PM, engineers, design, one or two stakeholders):
Frame (5 min): state the goal behind "value", the definition of effort, and the scale.
Silent individual placement (15 min): each participant positions every item on their own copy (or votes value/effort per item with planning-poker style cards). Silence first — otherwise the first loud opinion anchors the room.
Reveal and converge (30–45 min): place items where the group agrees instantly; park the rest. Then work the divergences — this is the valuable part. A feature placed "high value" by the PM and "low value" by support is a discovery gap wearing a sticky note. Timebox each debate to 4–5 minutes; unresolved items get an owner and an action (pull analytics, interview users) instead of a compromise placement nobody believes.
Read the map and decide (10 min): walk the quadrants and extract explicit decisions — what enters the backlog now, what gets split, what gets dropped. Photograph it, but transfer decisions to the backlog the same day; the photo is where matrices go to die.
Estimation tip: for effort, let the people who will build it speak last — engineers anchor everyone else, and you want their genuine estimate, not an echo. If your team already runs story point estimation, reuse those conventions for the effort axis.
The 4 quadrants — and what to do with each
Quick wins (high value, low effort)
Schedule them first and ship visibly — they buy credibility and momentum. But audit them: a genuinely high-value, low-effort item that nobody built yet is suspicious. Half the time its effort was underestimated or its value is unsourced. Quick-check before committing.
Big bets (high value, high effort)
The strategy quadrant. Three legitimate moves: split (find a thin slice that delivers value alone and often turns out to be a quick win), de-risk (spend two weeks of discovery before committing a quarter of delivery), or commit deliberately with a named sponsor and a kill criterion. The illegitimate move: letting a big bet absorb the roadmap by default because it was "already started".
Fill-ins (low value, low effort)
Do them opportunistically — between releases, during onboarding of new engineers, in slack time. Danger: because they are easy, they metastasize. A quarter that ships twelve fill-ins and zero quick wins felt busy and moved nothing. Cap them explicitly (e.g. max 15% of capacity).
Time sinks (low value, high effort)
Decline them — in writing, with the matrix as evidence. This quadrant is the polite, visual way to say no to a pet feature: the group placed it there, not the PM. Re-examine only if the value axis changes (new segment, new strategy).
Classic biases that skew the matrix
Effort optimism: teams systematically underestimate effort — integrations, edge cases, rollout, support load. Antidote: have builders estimate, add explicit "includes QA + migration + docs" to the definition, and compare past estimates with actuals once.
Unsourced value: value scores based on who spoke last, not on data. Antidote: require a source per high-value claim — feedback volume, revenue at stake, analytics. "High value because the CEO likes it" should be visible for what it is.
Top-right clustering: when everything lands in quick wins, the scale has failed. Force ranking: at most a third of items per quadrant, or re-anchor the axes ("the hardest item here is a 5").
Anchoring: whoever places first drags the room. That is what the silent round is for.
Static matrix: placements decay as estimates and strategy change. A matrix older than a quarter is a historical document.
Confusing loud with valuable: the demanding customer's request is "high value" because it is high volume in your inbox. Check who else wants it — this is where a systematic approach to prioritizing customer feedback beats memory.
When to move to richer scoring (RICE, HeroScore)
The matrix is a triage tool, and it tells you itself when it is saturated. Upgrade when:
Quadrants are crowded: eight items in quick wins and no way to order them — you need a finer ratio, not a bigger sticky note.
Decisions get relitigated: a two-axis placement is easy to contest a month later; a scored ranking with visible criteria is defensible.
Uncertainty matters: the matrix treats a measured value and a hopeful guess identically. RICE's Confidence factor exists precisely for that.
Time pressure appears: deadlines and decaying opportunities need a time-criticality dimension — the territory of WSJF.
Multiple goals compete: when "value" must balance revenue, retention and strategic bets, you need weighted criteria, not one axis.
The healthy pattern is a pipeline: matrix workshop to triage raw ideas, then a multi-criteria score to sequence what survives — see how to prioritize your backlog for the full framework landscape.
From matrix to backlog in RoadmapHero
The weak point of any matrix workshop is the day after: decisions live in a photo. In RoadmapHero, teams run the same triage on the backlog itself — value and effort as scoring criteria on each ticket — and when the matrix saturates, they extend the same tickets to HeroScore, the configurable multi-criteria score (business value tied to OKRs, user value weighted by Customer Voice feedback, effort, risk, urgency). Nothing is re-entered: the workshop's value/effort judgments become the first two criteria of the richer model, and AI-assisted prioritization highlights items whose placement looks inconsistent with the feedback linked to them. The resulting priorities feed roadmap views shareable in one click with unlimited viewers. Free trial, transparent pricing in euros, no commitment.
Frequently asked questions
What is a value vs effort matrix?
It is a 2×2 grid that plots each backlog item by the value it should create (vertical axis) and the effort it takes to build (horizontal axis). The four quadrants — quick wins, big bets, fill-ins and time sinks — each map to a clear decision, which makes the matrix the fastest prioritization tool to learn.
What scale should I use for value and effort?
Keep it coarse: 1–5 or t-shirt sizes per axis. The matrix is a triage tool, and fine-grained scales create false precision. What matters is defining value against a specific goal and effort as total team effort, and keeping the definitions identical for every item.
How many items can I place in one matrix session?
Between 10 and 25. Below 10 the exercise is overkill; above 25 the discussion degrades and placements get sloppy. If your backlog is bigger, pre-filter it first or run separate sessions per theme.
What is the difference between the value/effort matrix and RICE?
The matrix uses two coarse, workshop-friendly dimensions, while RICE computes a numeric score from four factors including Confidence. The matrix is faster and better for group alignment; RICE is finer and better for defending a ranking over time. Many teams triage with the matrix, then score the survivors with RICE.
Should big bets always be avoided?
No — big bets are often where the strategy lives. The matrix flags them as needing a real decision: split them into thinner slices, run discovery to de-risk them, or commit deliberately with sponsor backing. What the matrix prevents is drifting into a big bet by accident.