Project status report and dashboard: KPIs, RAG status, template
How to build a one-page project status report and dashboard: which project KPIs to track, honest RAG status without watermelon projects, and report cadence.
By the RoadmapHero team · Updated on · 9 min read
Key takeaways
- A useful project status report fits on one page: an overall RAG status with its trend, four KPIs (schedule, budget, scope, risk), upcoming milestones and decisions needed.
- RAG status only works when thresholds are written down at kickoff and red means "we need a decision from outside the team," not "someone failed."
- A watermelon project is green on the outside and red on the inside; the fix is measuring progress on finished, accepted deliverables instead of self-reported percentages.
- A common cadence is a weekly team update, a weekly or biweekly one-page report to sponsors, and a monthly steering committee for deeper review and decisions.
A project status report is a one-page summary that tells sponsors whether a project will deliver what was promised, on time and on budget, and what they need to decide. The best ones share the same skeleton: an overall RAG status (red, amber, green) with a trend, four to six project KPIs with thresholds agreed in advance, the next milestones, the top risks and a short list of decisions needed. A project dashboard is the living version of that page.
Most project dashboards don't fail for lack of data. They fail because they show too much, or because they are too comfortable: forty metrics, green every week, then a surprise two weeks before go-live. This guide covers which KPIs to track, how to structure the one-page report, how to keep RAG status honest, how often to report, and how to automate the mechanical part without automating away judgment.
What is a project dashboard, and who is it for?
A project dashboard is a regularly updated, at-a-glance view of a project's health, designed to help a specific audience make a specific decision. Two failure modes sit on either side of that definition: the vanity dashboard, which reassures without informing, and the kitchen-sink dashboard, which shows every metric the tools can produce.
It helps to separate three activities that often get lumped together:
Project tracking is the continuous work of comparing plan versus actual.
Project reporting is the periodic communication of that tracking to people outside the team.
Project control is what you do with it: re-plan, trade off, escalate, or stop.
A dashboard exists to support control. If it never triggers a decision or an action, it's an activity log.
There are also three levels of reading. The project team needs operational detail every day. Sponsors and the steering committee need a one-page summary. Leadership or the PMO needs a consolidated view across projects, closer to an executive dashboard. This article is about the middle level: the bridge between the work and the people who fund it.
Which project KPIs should you track?
Core project KPIs come from the classic triple constraint — schedule, cost, scope — plus risk, because that's where next month's delays are hiding. For a mid-sized project, five to seven KPIs is plenty. Beyond that, nobody reads them.
KPI | Formula | Green / amber / red (rule of thumb) |
|---|---|---|
Milestone slippage | Current forecast date minus baseline date for the next key milestone | Up to 1 week / up to 3 weeks / more |
Budget burn vs. progress | Percent of budget spent minus percent of deliverables completed | Within 5 points / 5 to 10 / over 10 |
Deliverables completed | Accepted deliverables divided by deliverables planned to date | 90% or more / 75% or more / below 75% |
Change requests | Approved scope changes since baseline, per month | 0 to 1 / 2 to 3 / more than 3 |
Critical open risks | High-severity risks with no active mitigation | 0 / 1 / 2 or more |
Key resource load | Planned work divided by available capacity for critical people | Up to 90% / 90 to 110% / over 110% |
Treat these thresholds as starting points, not standards. A regulatory project with a hard deadline tolerates far less schedule slippage than an internal improvement project. What matters is that you write the thresholds into the project charter at kickoff and don't renegotiate them the week they turn inconvenient.
Leading vs. lagging indicators
Budget spent and missed milestones are lagging indicators: by the time they turn red, the damage is done. Pair them with leading indicators that warn you earlier: load on key people, the number of external dependencies still waiting, the age of open risks, and the number of pending decisions. A project with three decisions stuck for a month is going to slip, even if every milestone is still green.
On large programs, earned value management formalizes this with two ratios, the schedule performance index (SPI) and the cost performance index (CPI); anything below 1.0 signals drift. It requires a rigorously costed plan. For most projects, the simpler burn-vs-progress comparison above gives you most of the signal.
The one-page project status report template
The status report is what sponsors read between two steering committees. It should take two minutes to read and never spill onto a second page.
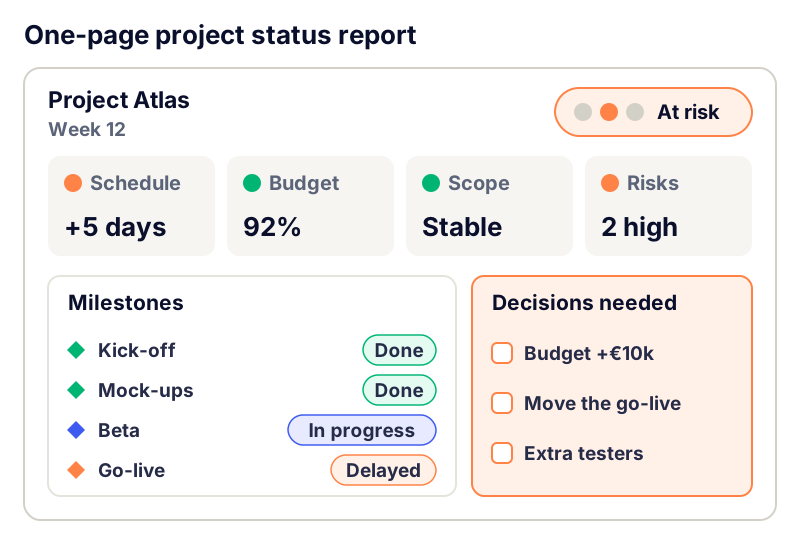
Header and overall status. Project name, sponsor, reporting date, RAG status, and trend since the last report: improving, stable or declining.
Three highlights. What got done, what changed, what's blocked. One sentence each.
Four KPI tiles. Schedule, budget, scope and risk, each with a value, a color, and a one-line explanation whenever it isn't green.
Upcoming milestones. Baseline date, current forecast and status for each. Sponsors read this part first.
Top three risks and issues. Each with a mitigation and a named owner.
Decisions needed. Written as closed questions, with a recommendation and a deadline.
Trend matters as much as color. An amber project that has been improving for three weeks calls for a very different response than a green project quietly sliding.
Milestones only mean something when compared to a frozen baseline. If you don't have one yet, start with a project plan built backward from the deadline.
How do you keep RAG status honest?
RAG status (red, amber, green) compresses a project's health into one color. It's useful because it forces a judgment call. It becomes dangerous when that call bends under pressure.
Definitions that hold up:
Green: schedule, budget and scope targets will be met; any variance is absorbed by the team.
Amber: there's a deviation, but the team has a recovery plan it can execute on its own.
Red: a target is at risk and can't be recovered without a decision from outside the team — more budget, less scope, a new date or more people.
With that definition, red isn't a failure. It's a request for help addressed to the sponsor.
What is a watermelon project?
A watermelon project is green on the outside and red on the inside. Status reports show green week after week, then the project jumps straight to red a few days before a milestone. The delay was there all along; it got diluted at every layer of reporting.
The causes are well known: fear of looking bad, self-reported status nobody checks against evidence, roll-ups that round toward green, and no written thresholds. So are the fixes:
Measure progress on finished, accepted deliverables, not on a percent-complete someone eyeballed.
Apply mechanical rules: a milestone that has slipped twice can't be green; two amber reports in a row without improvement become red.
Report color (where we are) separately from trend (where we're heading).
Train sponsors to answer red with "what do you need?" rather than "why?"
Sample the status directly with the team from time to time, not only through the project manager.
Watch for the 90% syndrome: a task that has been "90% done" for three weeks isn't nearly finished, it's stuck. The 0/100 rule avoids it: a deliverable counts as done only once it's accepted.
How often should you report project status?
The right cadence depends on project length and risk, but a three-tier rhythm works for most projects:
Weekly, for the team: update the plan and statuses, plus a 15-minute review of blockers and risks.
Weekly or biweekly, for sponsors: the one-page status report, sent on a fixed day.
Monthly, for governance: a deeper review and decisions at the project steering committee, prepared from the previous reports.
A three-month project runs on a weekly rhythm; an 18-month program can move to biweekly reports. One rule doesn't change: a red event doesn't wait for the next report. If a key milestone is compromised, the sponsor should hear about it within 24 to 48 hours, together with the options.
Finally, tailor the format to the reader. Sponsors want status, milestones and decisions; business teams want to know what changes for them and when; finance wants the budget. All of these messages should come from the same source. Our tips for communicating with stakeholders go deeper on adapting the message.
How to automate project reporting without losing judgment
Chasing people for updates, copying dates into a spreadsheet, rebuilding charts, formatting the deck: on many projects, reporting eats a real share of the project manager's week, at the expense of actually running the project. Automation handles the mechanical part if you follow five principles.
One source of truth. The report should be a view of the plan and backlog, not a parallel file that drifts from reality by week two.
Data that flows in by itself. Progress the team records in its own tools — Jira, GitHub or others — should feed the dashboard without re-typing.
Calculated facts. Milestone slippage, completed deliverables, budget burn: anything that can be computed should be computed.
Human judgment on top. The final RAG call, the commentary and the decisions requested are the project manager's real contribution. A tool can suggest a color; it can't own it.
Delivery where people already read. Email, Slack, Teams or a shared link: a report people have to go looking for doesn't get read.
In RoadmapHero, for instance, each item's health (late, moved, new) is flagged semi-automatically from the plan, dependent tasks are re-planned when a delay is entered, and sponsors can open an up-to-date view through a link without creating an account.
Common project status reporting mistakes
Too many metrics. If the dashboard doesn't fit on one page, it won't be read. Put the detail in an appendix.
Reporting activity instead of outcomes. "The team held twelve meetings" says nothing about the project's health.
No baseline. Without a frozen schedule and budget, you can't measure variance; everything is "as planned."
A stale risk log. A risk register that hasn't changed since kickoff is dead. Review it weekly using a clear project risk management process.
No decisions requested. A report with no ask implies everything is fine, even when it isn't.
A report that lags reality. A status frozen on Thursday and read the following Tuesday already describes the past.
Status reporting is one piece of project control. To see where it fits in the full lifecycle, from charter to lessons learned, read our project management guide. And if you'd like your status report to build itself from the live plan instead of a spreadsheet, you can create an account.
Frequently asked questions
What should be included in a project status report?
A project status report should include the overall RAG status and its trend, a few highlights since the last report, four core KPIs covering schedule, budget, scope and risk, upcoming milestones with baseline and forecast dates, the top three risks with owners, and the decisions needed from sponsors. Keep it to one page and move supporting detail to an appendix so it can be read in two minutes.
What are the most important project KPIs?
The essential project KPIs cover four dimensions: schedule (slippage on key milestones), budget (spend compared with actual progress), scope (deliverables completed and change requests) and risk (critical risks without mitigation). Many teams add the load on key people as a leading indicator. Five to seven KPIs is usually enough, each with green, amber and red thresholds agreed at kickoff.
What does RAG status mean in project management?
RAG stands for red, amber, green, a traffic-light rating of project health. Green means targets will be met, amber means there is a deviation the team can recover on its own, and red means a target is at risk and needs a decision from outside the team, such as more budget, less scope or a new date. Written thresholds keep the rating consistent across projects.
What is a watermelon project?
A watermelon project looks green in status reports but is red in reality, like a watermelon, green outside and red inside. It usually comes from self-reported progress, fear of escalating bad news and roll-ups that round toward green. The fix is written thresholds, progress measured on accepted deliverables, mechanical escalation rules and sponsors who treat a red status as a request for help, not a failure.
How often should you send a project status report?
Most projects work well with a weekly team update, a weekly or biweekly one-page report to sponsors and a monthly steering committee. Shorter or riskier projects need a tighter rhythm. Whatever the cadence, a critical event such as a compromised milestone should reach the sponsor within 48 hours, with options, rather than waiting for the next scheduled report.